Victoria COVID-19 Plot
Below is a project that I have been working on to plot various datapoints from the Victorian COVID-19.
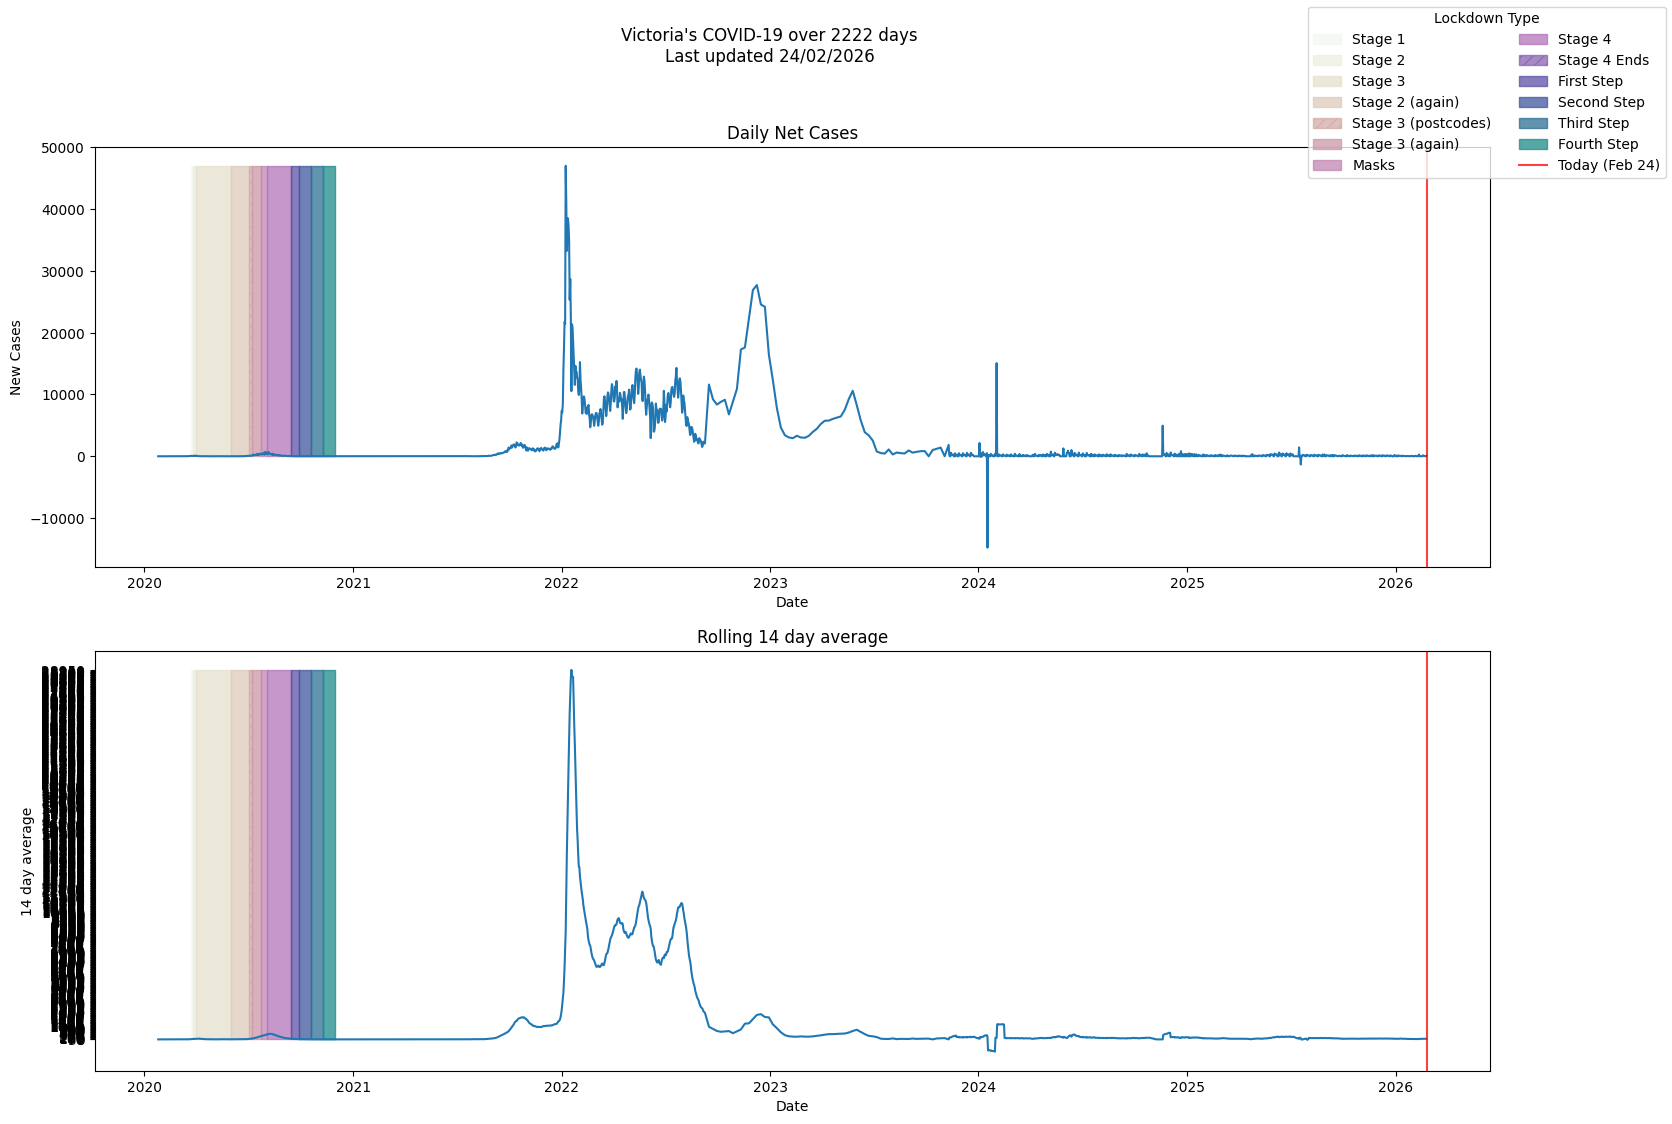
This script scrapes from COVID LIVE automatically every morning at 10AM AEDT, and plots daily net cases and rolling average.
I initially started this project to work on test the data science skills (scraping, cleaning and visualising) that I had learnt at university, however my peers found it an essential resource that they could see how Victoria’s case numbers were trending. This project also furthered my Linux skills, as I wrote a GitHub actions script to deploy a server daily to generate new plots.
Here is an example of the daily plot produced:
The open-source project can be accessed here.