VegaLite CourseWork
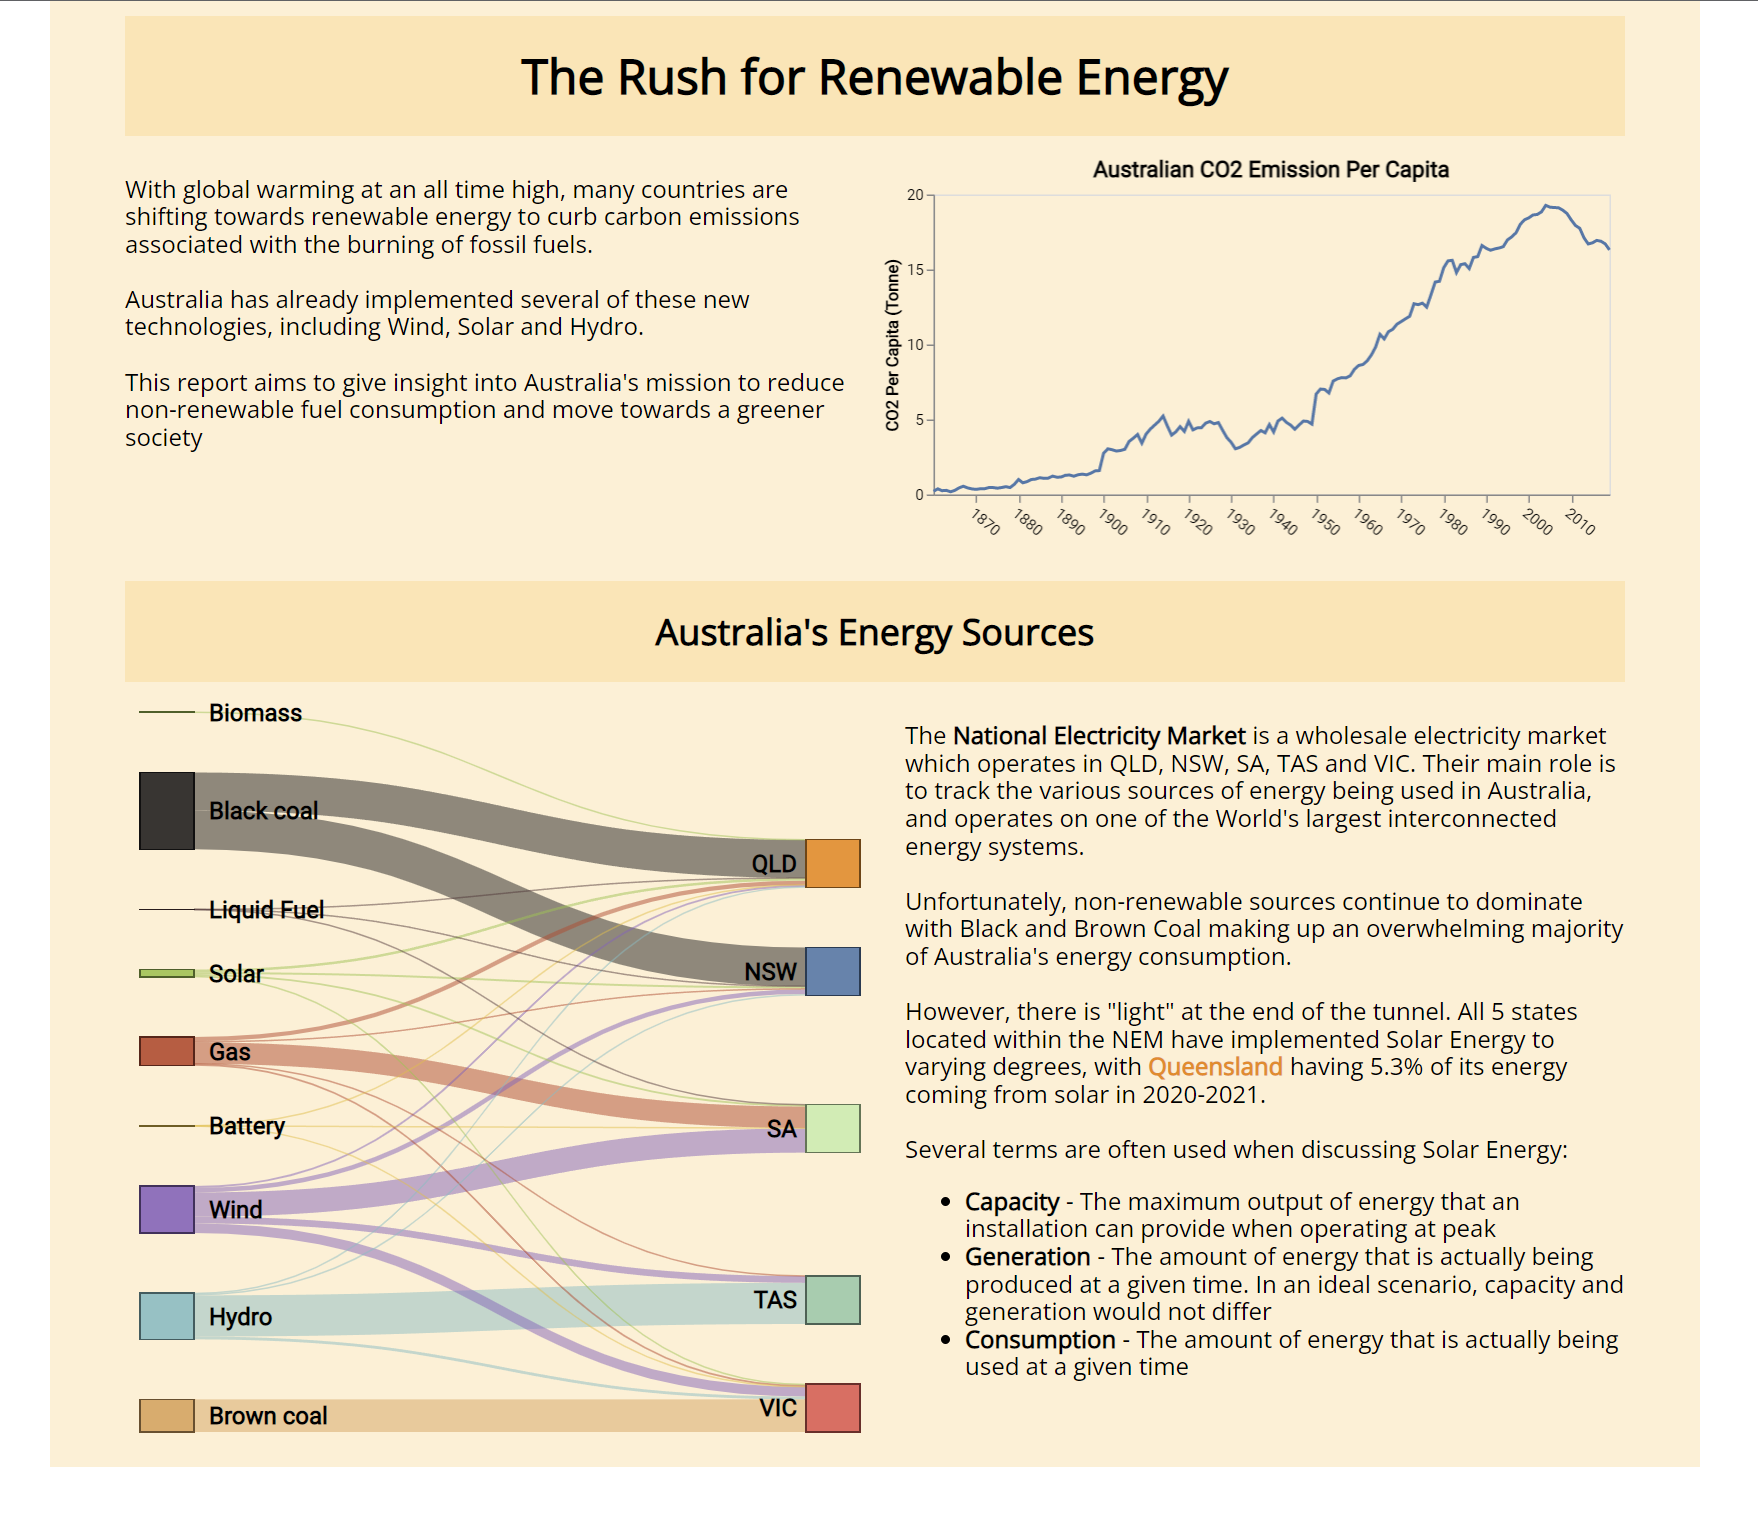
Following on from my previous post, my next assignment for FIT3179 Data Viz at Monash University was a similar project. For this project, I investigated the uptake of solar energy in Australia.

This project was my first exposure to client side data visualization, through the Vega-Lite and d3.js libraries. The source code for this project is available here and the live-copy of the visualization here.